With COVID-19, we dealt with a pandemic that quickly changed how we go about our daily lives. Schools closed, businesses closed, and we couldn’t find toilet paper anywhere. The never-ending cycle of COVID-19 news made it hard to focus on anything else (or maybe that was just me?).
I took a break from scrolling through Twitter to read the latest doom and gloom scenarios to take a look at how this pandemic impacted search behavior on Google.
These trends may seem obvious, but it’s interesting to see the huge shift in search demand for many of these queries.
Demand for store specific delivery exploded.
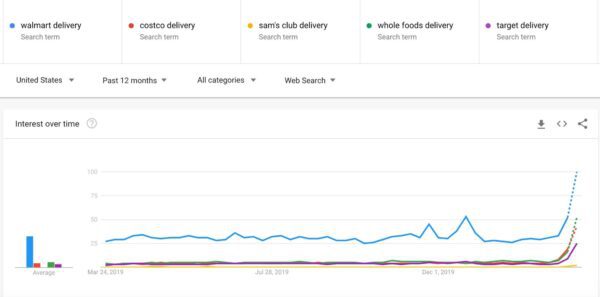
I’m not surprised by this trend, but I wonder why the demand for Sam’s Club isn’t a bit higher.
If you’re like me, you didn’t want to venture outside to get anything.
Trends for the most generic, high-level delivery terms were way up as well, but to me, this clearly shows that shopper store preferences were not changing.
The demand for meal delivery services exploded.
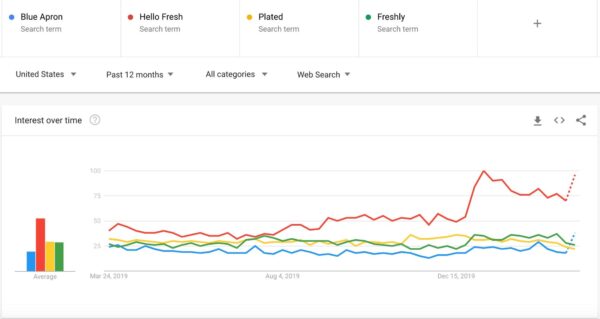
Grocery stores were running low on everyday items, including meat, bread, and eggs. Many Americans sought alternative options to get meals delivered directly to their door.
What’s interesting is that Plated and Freshly trended down after trending above Blue Apron for the prior 12 months.
I’m not exactly sure why this happened. Organically speaking, Plated has lost a significant amount of traffic (which points to SEO issues), but both Plated and Freshly bring in hundreds of thousands of users each month.
Why did they trend down compared to Hello Fresh and Blue Apron? Maybe traditional advertising (TV, radio, etc.) played a role here. What do you think?
Demand for airline refunds was through the roof.
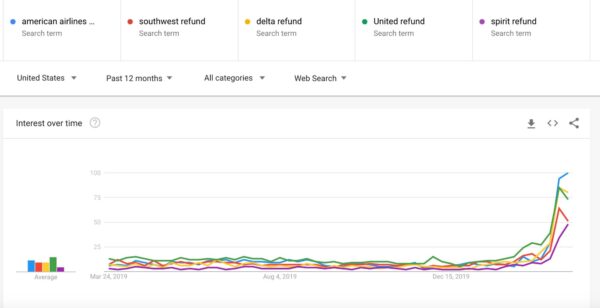
Again, no surprise here. There were travel restrictions in place, and many people were afraid to travel (myself included). American Airlines sees the most demand in terms of refund searches.
American does have the largest fleet size in the U.S., but Delta leads the industry in terms of revenue. Could their basic economy tickets cause the spike?
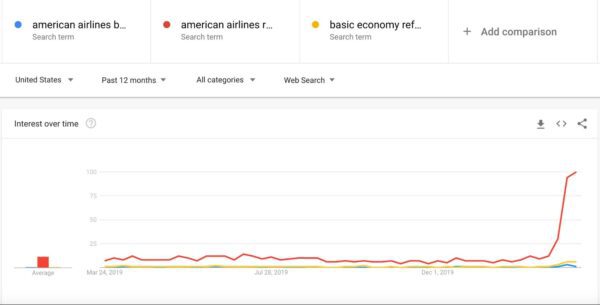
While there was some demand for basic economy refunds (branded and non-branded), it’s not matching the trends for the high-level query (like the American Airlines refund).
Greyhound and Amtrak see similar (less extreme) refund trends.
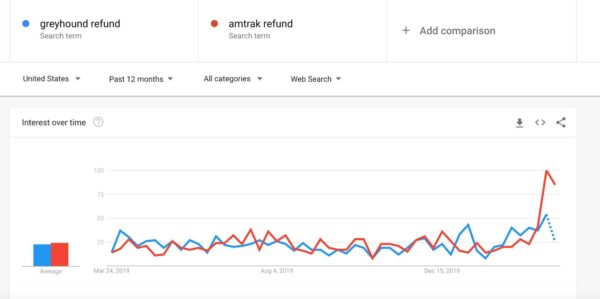
Anything related to travel saw a spike in refund-related demand. What’s interesting is that the demand for a “Greyhound refund” wasn’t much higher than it is typically.
Maybe there’s a more significant quality issue with Greyhound. The demand for Amtrak refunds exploded, especially when compared to Greyhound.
When you look at the rider data, it’s a bit more clear. Greyhound serves about 16 million passengers per year, while Amtrak servers about 31 million passengers per year. The demand for refunds will be much higher than Greyhounds.
Refund demand for gym memberships increased (also users searching to check if their gyms were open).
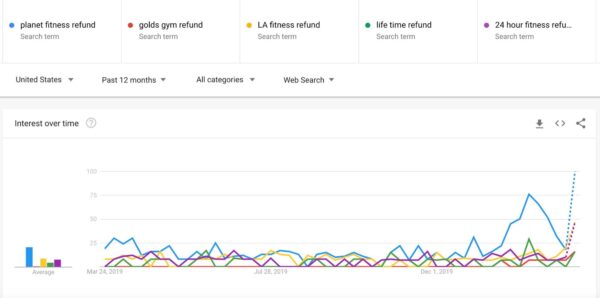
We should do everything that we can to flatten the curve, but the urge to work out is still there. If you’re like me, you probably have a gym membership, and while my gym is still open, I didn’t have any plans on going to work out.
Since I am self-isolating, I thought about canceling my membership, and the data shows that I am not alone.
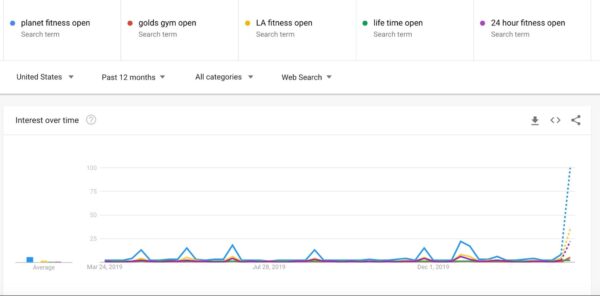
What’s even more interesting is that demand for “gym + open” is way up as well. Even in the face of an epidemic, people want to get their swole on. Seriously, people stay home!
Demand for alcohol delivery queries sees a boom.
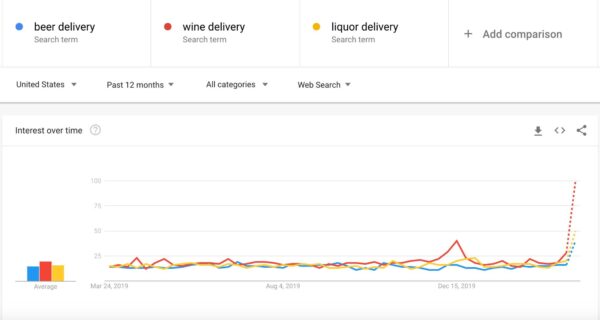
I was surprised by this one. I wasn’t surprised that people searched for beer and wine delivery, but wine delivery is crushing anything related in terms of search demand.
I shared this screenshot with the team and got some interesting thoughts.
With many Americans not able to go to the gym, they were more conscious of the calories/carbs in beer. Wine is perceived as “healthy” compared to beer. Also, wine is easier to carry around compared to a 24-pack of brews.
What do you think?
Demand for bidets has exploded due to the low-supply of TP.
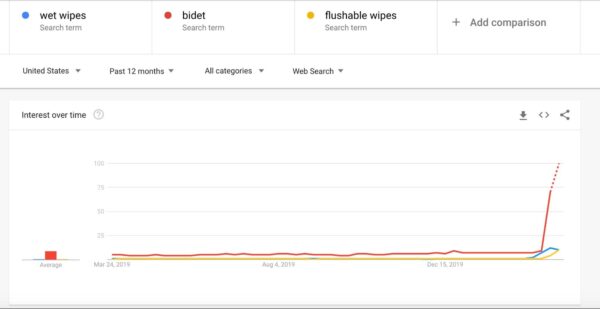
Bidets are popular outside of the U.S., but with the shortage of TP, the search demand has exploded.
What’s interesting is that the demand for flushable wipes/wet wipes has hardly increased when compared to the demand for bidets. I have a bidet, but STOP hoarding TP people!
Demand for dumbbells and home workouts exploded.
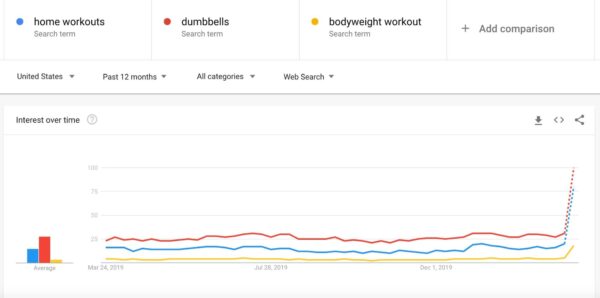
When you’re self-isolating and dealing with the weight of this situation, those calories can sneak up on you.
Exercising is a great way to give your mind and body a break from the constant stress of this situation. Even with the gym closures, the demand shows that many Americans still looked for ways to exercise at home.
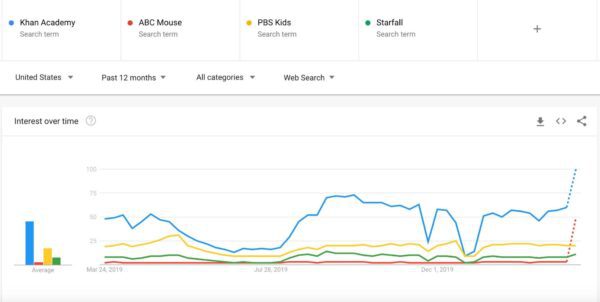
Schools closed, but the demand for learning is open.
Most schools canceled classes for at least two weeks. Depending on how this situation unfolds, many students may be out of school for the remainder of the school year.
Many schools developed take-home learning packets, or in some cases, they held classes online via Zoom.
My first grader wouldn’t sit long enough for a Zoom class, so that’s not an option for everyone.
The demand trends showed that parents (or older students) searched for alternative means of learning like Khan Academy and ABC Mouse.
I assumed that the demand for PBS Kids would be up as well, but it’s not.
Demand for remote communication tools has grown.
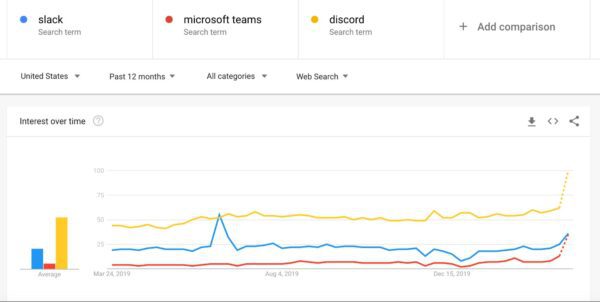
Like most companies, we use Slack. Microsoft Teams is about even with Slack in demand over March after lagging for the last 12 months.
I’ve never used Microsoft Teams, so I can’t speak to its features, but they did a good job for companies that transitioned to remote work for the first time.
The demand for video conferencing tools grew.
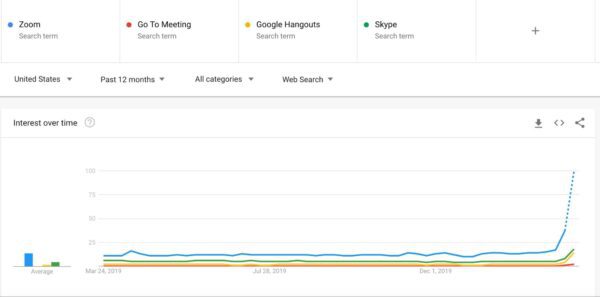
Zoom is one of the most stable video conferencing tools that I’ve ever used, and that seems to be the case with everyone that I know.
So there’s no surprise that the demand for Zoom is zooming. Demand trends grew slightly for other video conferencing tools as well, but it pales in comparison to Zoom.
There’s a lot of uncertainty with business owners.
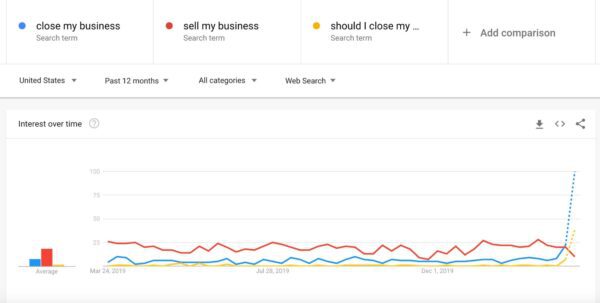
Unfortunately, a lot of businesses were hit hard. Local businesses closed, and the businesses that didn’t close saw huge drops in revenue due to the decline in foot traffic.
With this, a lot of business owners searched for queries that revolve around closing their business. The demand trend for “sell my business” is trending down, which further highlights the current uncertainty in the market. If you can, please support your local businesses.